Astro Pi - Reflections from Team Pithons
9 min read
February 5, 2023
Astro Pi is a global competition where teams design and run an experiment on the International Space Station. There are 4 phases, each with its own challenges and goals. In 2021/22, Dom and I took part driven by our passion for space, science, and programming, launching ourselves to the top with a Highly Commended award. But how did we do it?
Oh, and our team name was "Pithons"... Pi like Raspberry Pi, Python like the programming language, but also the snake ;)
Phase 1 - Idea
The first step was Phase 1 - the initial idea to submit for judging. This step essentially determined the entirety of the project for the year, so we wanted to ensure we could strike a good balance between a manageable goal and something to make us stand out from the (very large) crowd.
The competition is usually divided into 2 categories, “Life in Space” and “Life on Earth”. Life in Space uses an RPi in the Columbus module of the ISS and allows a team to analyse conditions such as temperature and pressure onboard the station. To be honest, we weren’t terribly excited by this idea, as we mainly wanted to work on image processing and have the chance to take our own satellite images! So, we quickly settled on Life on Earth. Then all we had to do was think of a project… which proved much harder than expected.
Initially, we had two contrasting ideas, so we spent lots of time arguing amongst ourselves and trying to justify our idea to the other. Honestly, this was probably very constructive for the long-term, as we had to convince each other that we knew exactly how to execute our project idea. This helped us avoid incredibly difficult implementation problems, or overreaching the realms of possibility completely (like calculating Milankovitch cycles)!
Eventually, with just a week to go, we settled on a project. Our idea was to improve food security by reclaiming desert which could be used for agriculture. We planned to use the camera on the RPi module to map out plant health, but crucially we wanted to link plant health to the surrounding environment and explain what conditions were required to foster healthy vegetation. We would then look for all the areas with these good conditions, and if very little vegetation was present we would flag it as land to reclaim for farming. Simple, right?
The biggest factor for choosing this idea was achievability, we had a clear vision of how to implement this project and we knew it had the ability to be upscaled and developed further if we had the time. Another factor was the climate focus - we wanted to complete a project with scope to make an impact on the world, which distinguished this idea from all of the others.
So, with our idea sorted and the initial plan submitted on time (just about!), we eagerly awaited for news. And finally, our Phase 2 acceptance came through...
Phase 2 - Create
Before we did anything, we attended a webinar talking through the basics of our task. They went on about how we could go about coding our experiment and use the cameras effectively, including calculating ground distance per pixel.
So now we had the idea nailed, it was time to code. Unboxing the free kit they sent us, we got to work building up the RPi with the HAT and the camera.
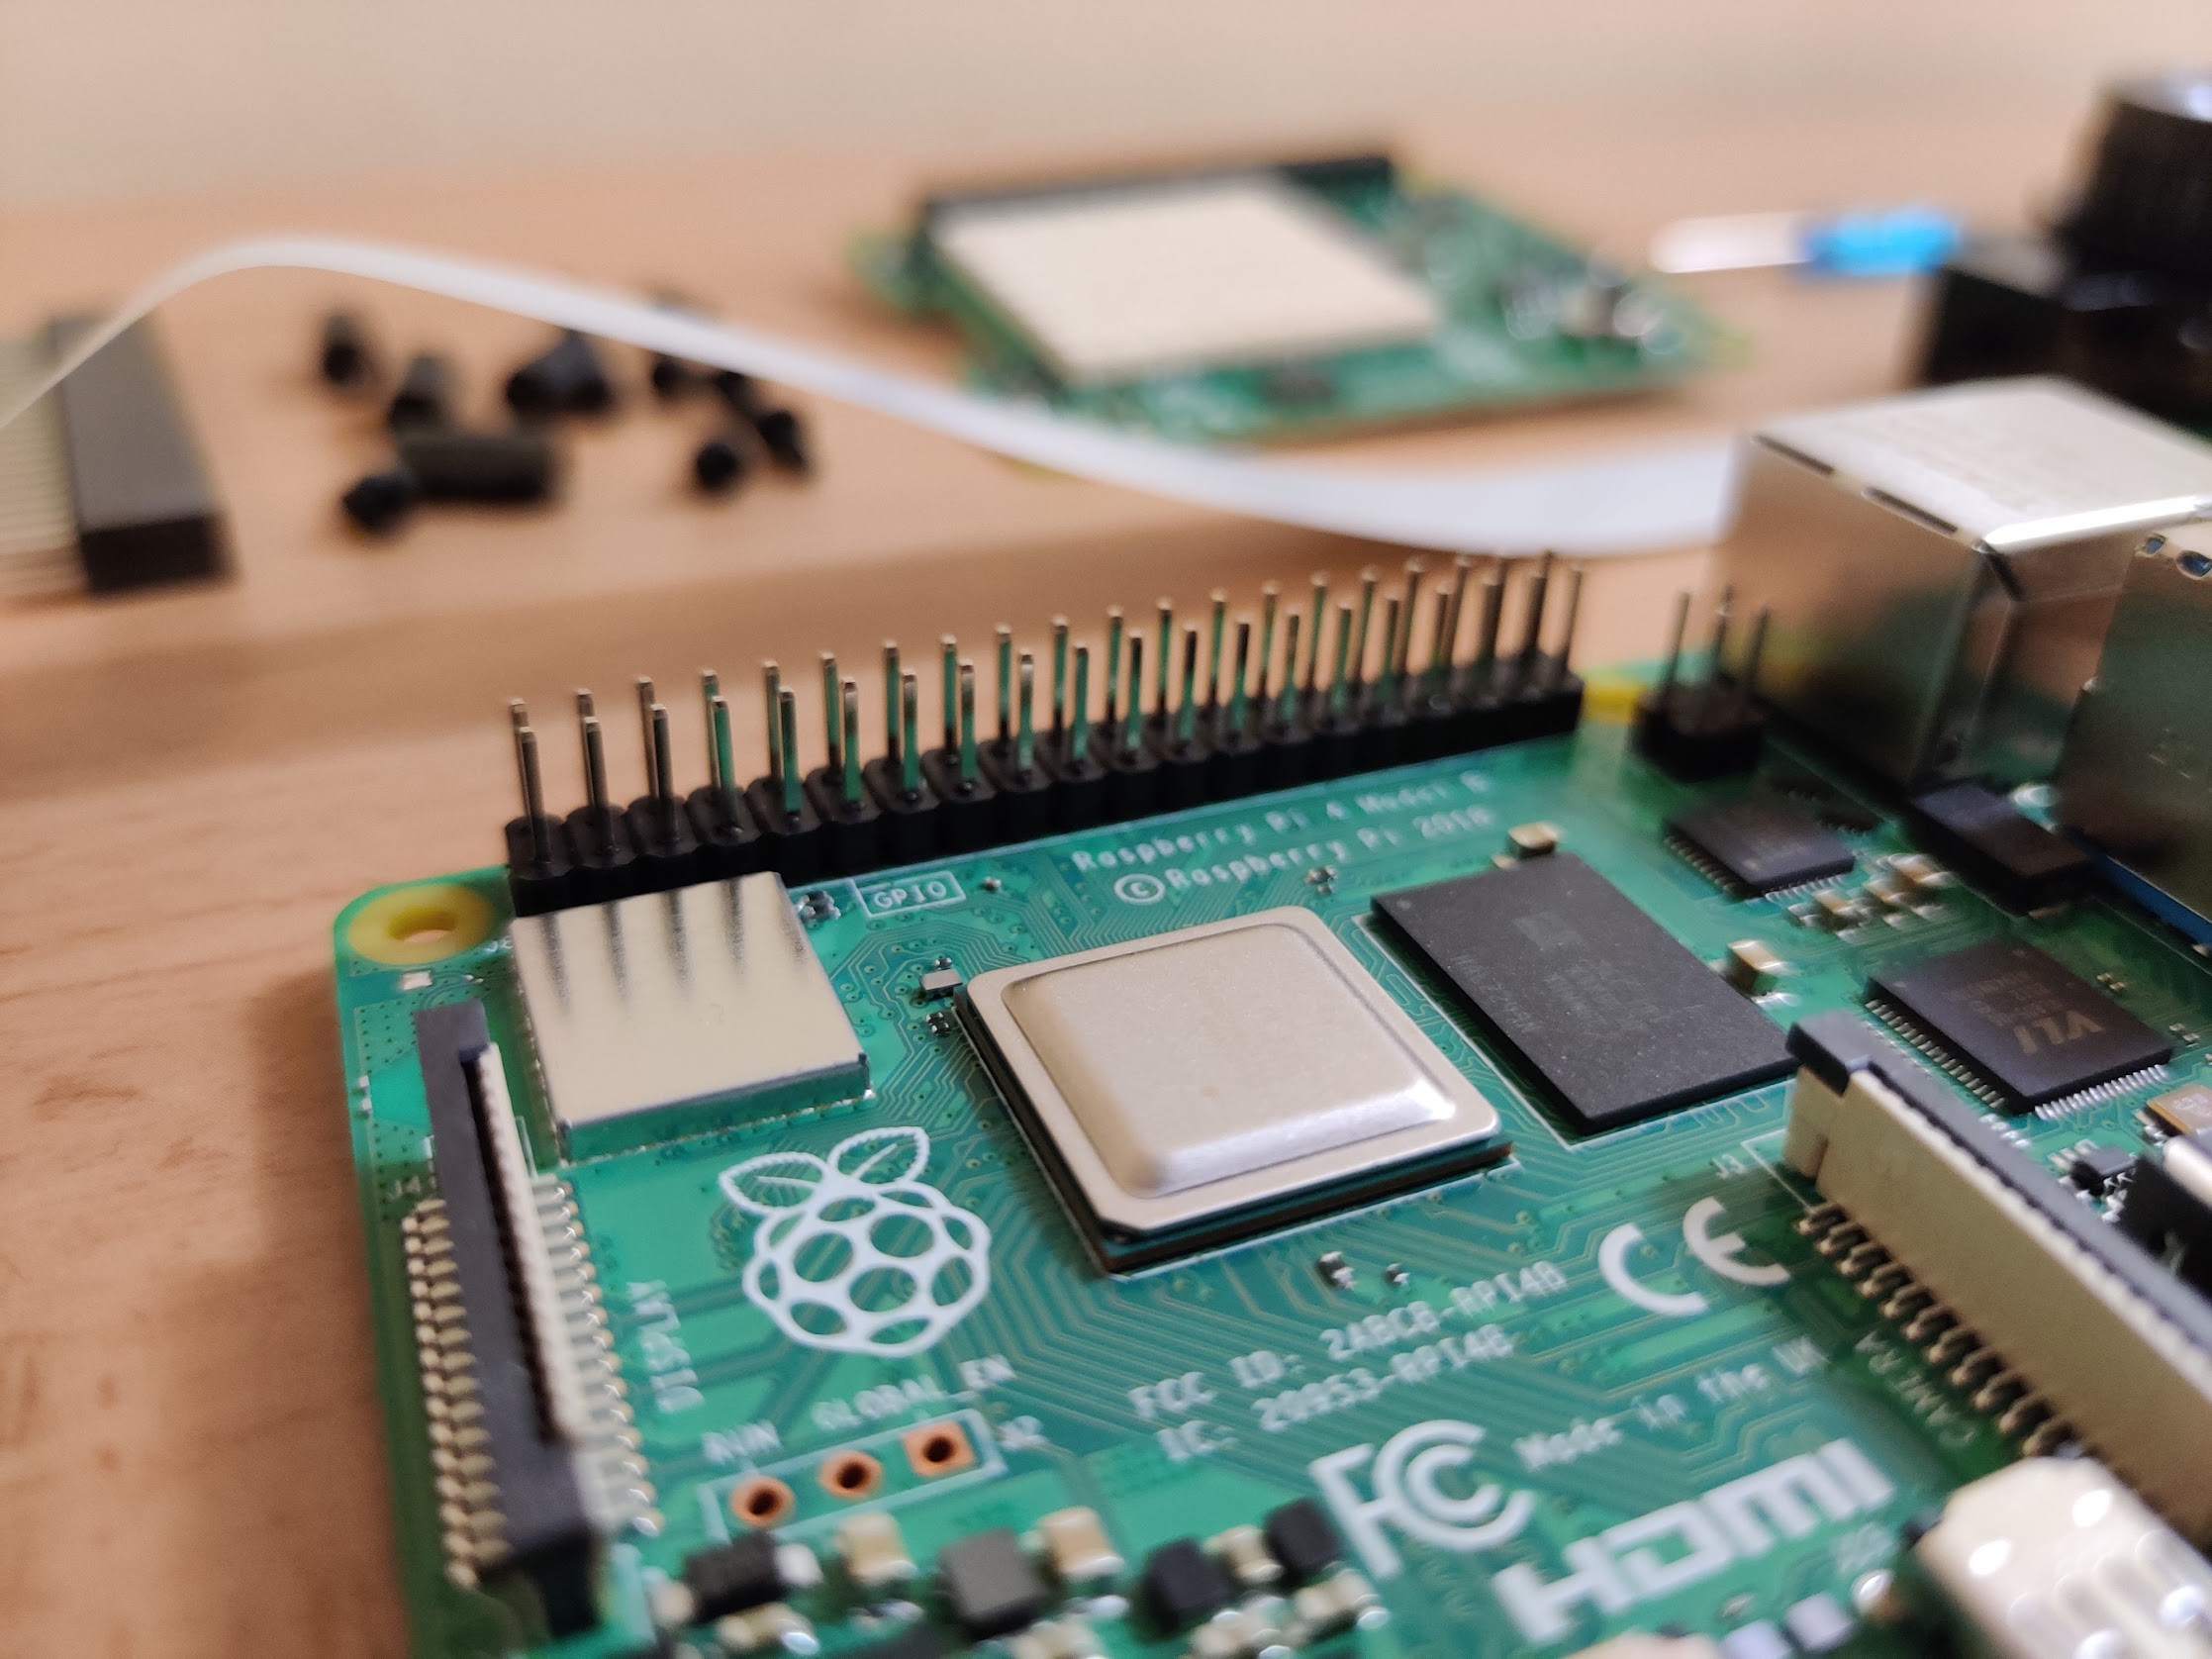
The chip on the Raspberry Pi 4, mingled alongside other components
Only one of us could use the RPi at once, so we coded most of the program locally and shared it between us using GitHub. It was a matter of compartmentalising all the code into a series of modular functions that we could split among us to maximise our efficiency. We used a lot of new tools, from Thonny on the custom Astro Pi OS, to libraries like picamera and logzero - learning all about logging was quite difficult but critical when it came to testing.
We followed the best programming practices we could, with ample whitespace, descriptive variable names, comments, and plenty of redundancy. Neither of us had ever coded like this before, so it was a pretty eye-opening experience - but for the first time in our lives, someone else would be reading our code too!
A particular challenge was the image filtering - to maximise our allotted 3GB of storage, we needed to delete as many images as we could. So images taken at night (where there is no light to see), over the ocean (no land to analyse), or with heavy cloud cover (land not visible) had to be removed. It took hours to find the most efficient and reliable method of doing this, but we eventually stumbled upon a technique where we compared the average pixel value in an image against pre-decided thresholds.
def is_useful(path):

    """ Checks to see if the image is over water/clouds

	so that we can delete it to save storage and processing
	because an image largely over water is useless for the task.
	The function takes the average light/darkness value and compares
	it to a known threshold to determine if the image is over water/clouds.

	INPUT: path location for image to check
	RETURN: a boolean, True if it is not over water/clouds, False otherwise
    """

    image = cv2.imread(path).astype(np.float)
    nir_val = np.average(image[:, :, 0])

    if cloud_threshold > nir_val > water_threshold:
		logger.info("image useful")
		return True

    else:
		logger.info("image not useful")
		return False
Once that was done, it came to testing... And we sure did loads of tests. Over the course of a week, the RPi must have been running our program for almost 30 hours as we battled against bugs and tried to hunt them all. Testing is perhaps the biggest stage in a commercial setting, so doing it here was insightful. And this is when we learned to appreciate the awesomeness of logging!
The code had to be completely robust, and handle all situations safely - if it crashed once on the ISS then we wouldn't get our data back. Working together, we dreamt up every error we could and patched them. We will admit though, at some point, we just wrapped the entire driver code in a try except block ;)
Finally, we had the code done and tested. All that was left was to submit it and see if it passed Astro Pi's threshold...
Phase 3 - Analysis
...and it did! At this point we were both so delighted that our code had been run on the ISS and had received our very own bespoke satellite images, that we almost forgot how much work we had remaining to get to Phase 4!
We got the data in the middle of our GCSEs - so it was time to get to work during the half-term break. We had already prewritten a lot of the image processing code in anticipation of time constraints, using sample images to test it. But as any programmer would tell you, there were bugs, there are always bugs!
First, we converted our Near InfraRed (NIR) images into images for each of our 3 indices (used to quantify certain characteristics, the science behind them is amazing and worth a read):
- SAVI - plant abundance
- RCI - plant health
- NDWI - water availability
This was tricky, but some open-cv and matplotlib magic got us what we wanted - after painstakingly calculating 3 different adjusted pixel values for every pixel in every image...
Okay, we may have been lying there - this didn't get us what we wanted. Firstly, cloud cover (white splodges in the image) needed to be discarded or else it would skew the results. After all, an algorithm fed with bad data will only output bad data. Oh, and the annoying black border around every image had to be cropped out too. Some more open-cv and numpy magic later, we had our images!
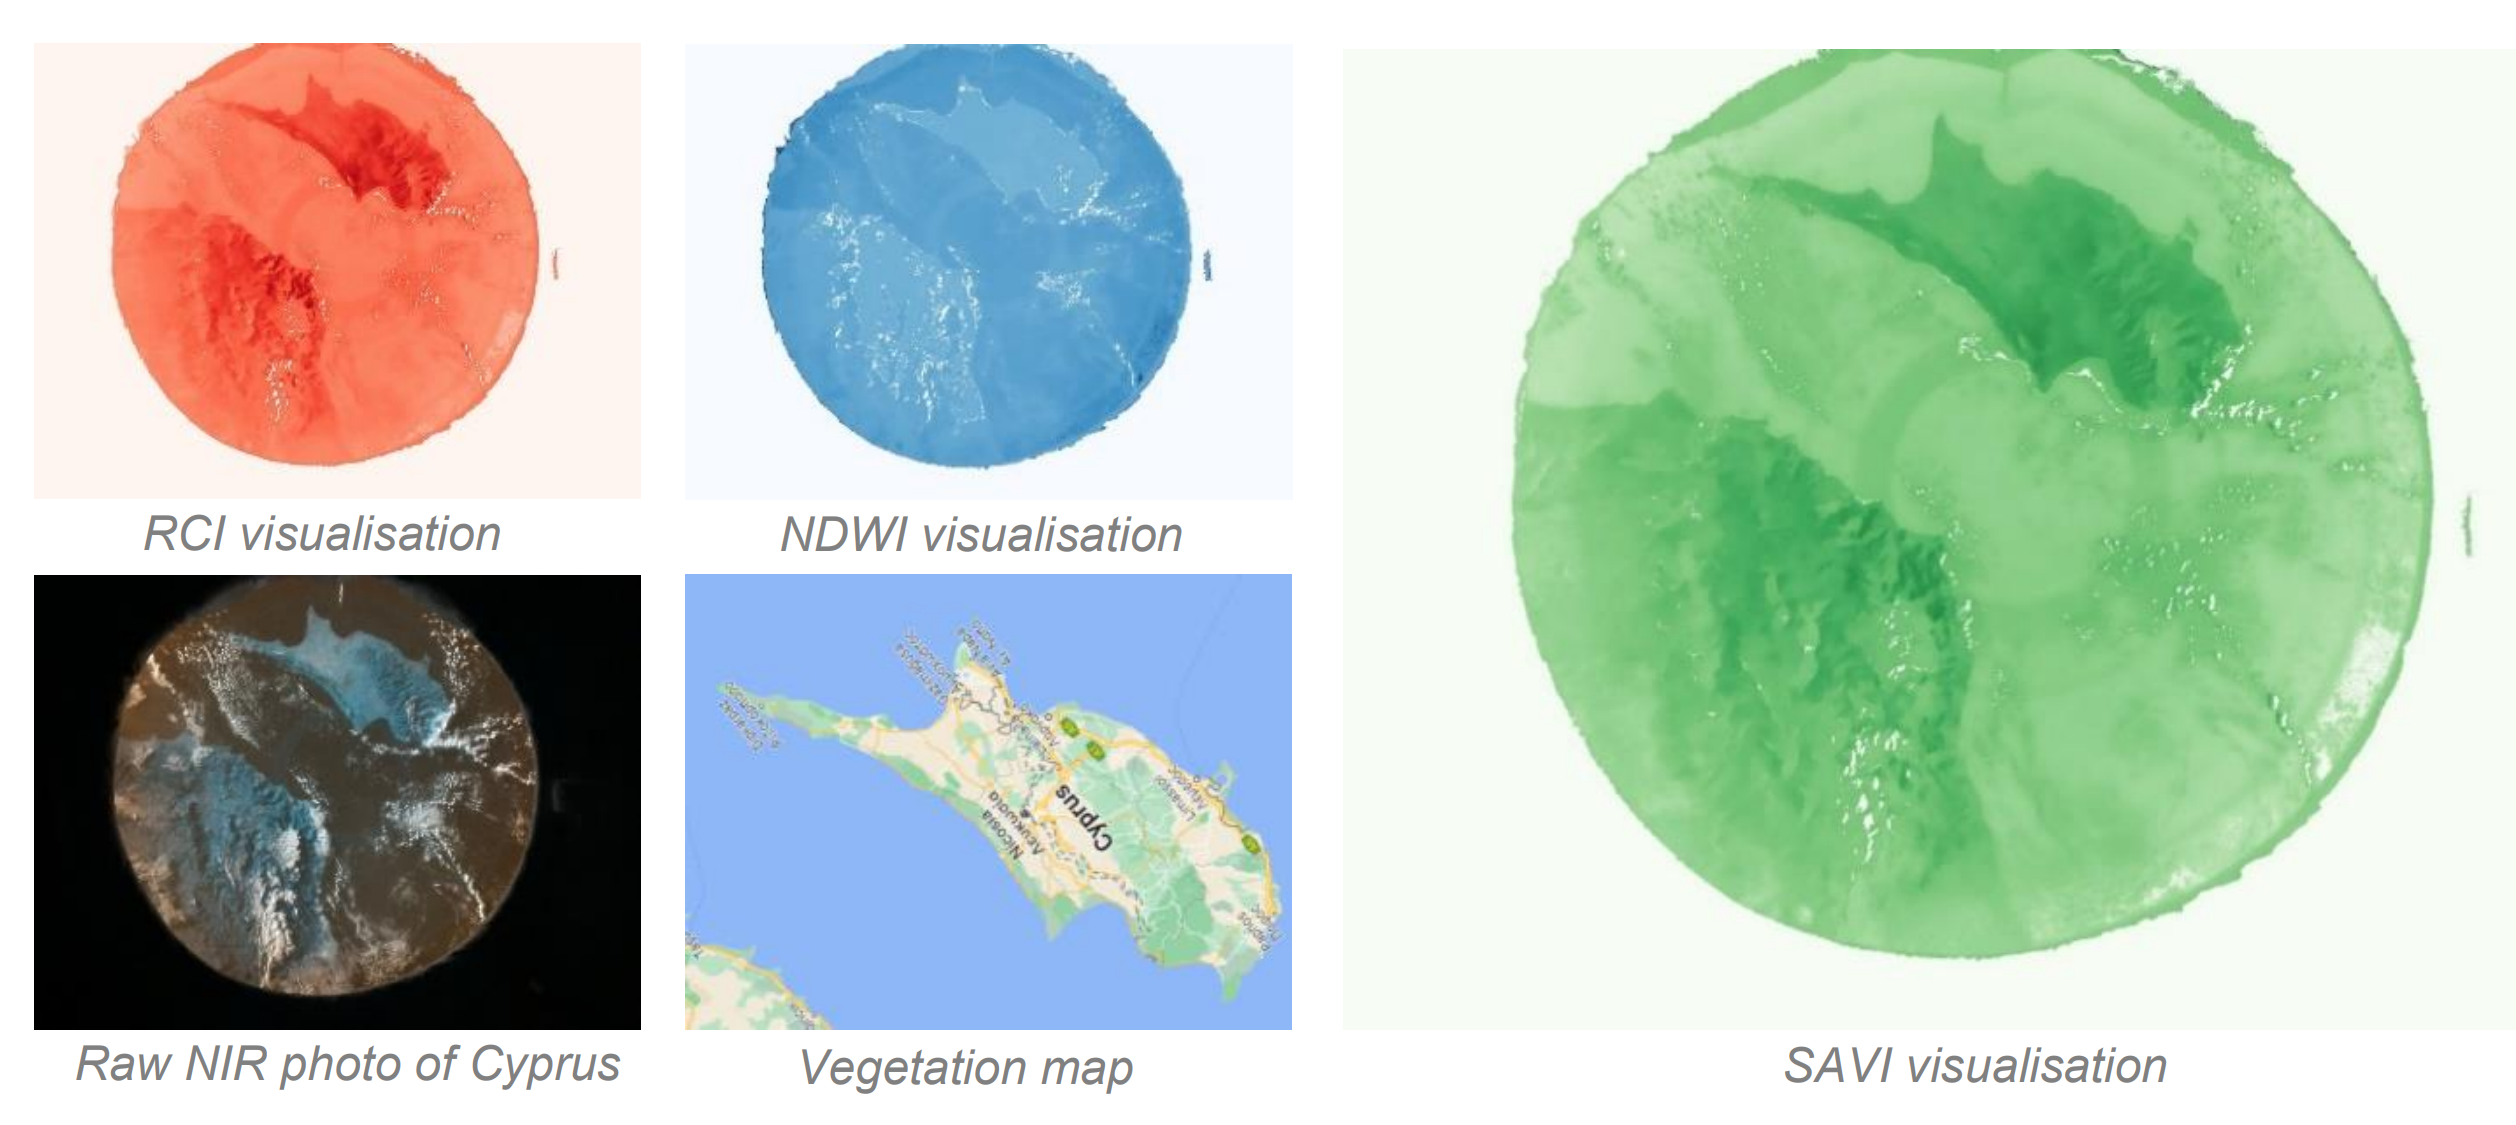
The bottom left image is one of the photos we received back on Earth. It's an NIR image, so the land appears blue(!) and the ocean appears black. The three coloured images visualise index values calculated from the original. The lower-centre photo is used to confirm the accuracy of our index values.
But then, we slammed into our first major problem. How do we actually compare hundreds of datapoints to find what we're looking for?
To simplify things, we calculated the average value for each index in each image. Next, we created our own "entropy" formula to use all the data collected and combine it into just one value per image. We then handpicked images with the highest entropies. As always in data science, this didn’t go entirely to plan at first, as any images taken over the ocean gave a huge reading! But, after sifting through plenty (we assure you we mean that) of images with associated high-ranking datapoints (getting good photos was quite a lottery), we eventually found some with land which we could use.
One of these, luckily enough, was over Tokyo City which provided the perfect case study to display our findings. And, it showed that our technique worked!
Phew, after a couple of intense days, our analysis was done.
Phase 4 - Report
Juggling the report writing with our GCSEs was tough - we assigned ourselves just a weekend to write our entire report. So the intense work continued.
We frantically went back and forth to figure out the best way to do things, and stick to the tight word limits. We wanted plenty of graphs and images to clearly show what we did and tell a story to the reader. We spent hours in voice calls just optimising the report and providing as much value in coherent, logical sentences as possible, choosing to include only the most critical information. We stuck to a distinct colour scheme for each of the three indices in our photos, maps, and equations for consistency, enabling the flow of the report.
Finally, we had a working draft but it would be almost another month until we submitted. Then, the month came around and one free night we got together to pour over every word for the last time, finalise the GitHub repo, and send in our complete report.
Yay!
Writing concisely was extremely difficult; we learned life-long skills in the process and though it shows but a small fraction of the effort we put in over the 9 months it took we're both immensely proud of our final product.
Conclusion
Astro Pi 2021/22 was a blast - we learned so much about so many things. Logging everything that happened in the code, testing it, working collaboratively, manipulating images, using Anaconda, and finding the time to write a report. It was a great journey and we'd strongly encourage anyone to give it a go next year (we even made a video). We're also mentoring a Year 11 team this year and can hopefully bring them to victory using our learnings. It gave us a good idea of what a career in programming could look like, the entire project pipeline starting from communicating our idea and ending with publishing our findings.
To get the winning email was a refreshing way to bring a close to the project. We had the chance to record a video question to be answered by astronaut Mattias Maurer in an exclusive livestream! And we got a whole pack of goodies alongside it.
Astro Pi is a competition that gave us insane amounts of value, so we're super grateful for this opportunity. We only scratched the surface of our project, so feel free to check out our code and report here, and thanks for reading!
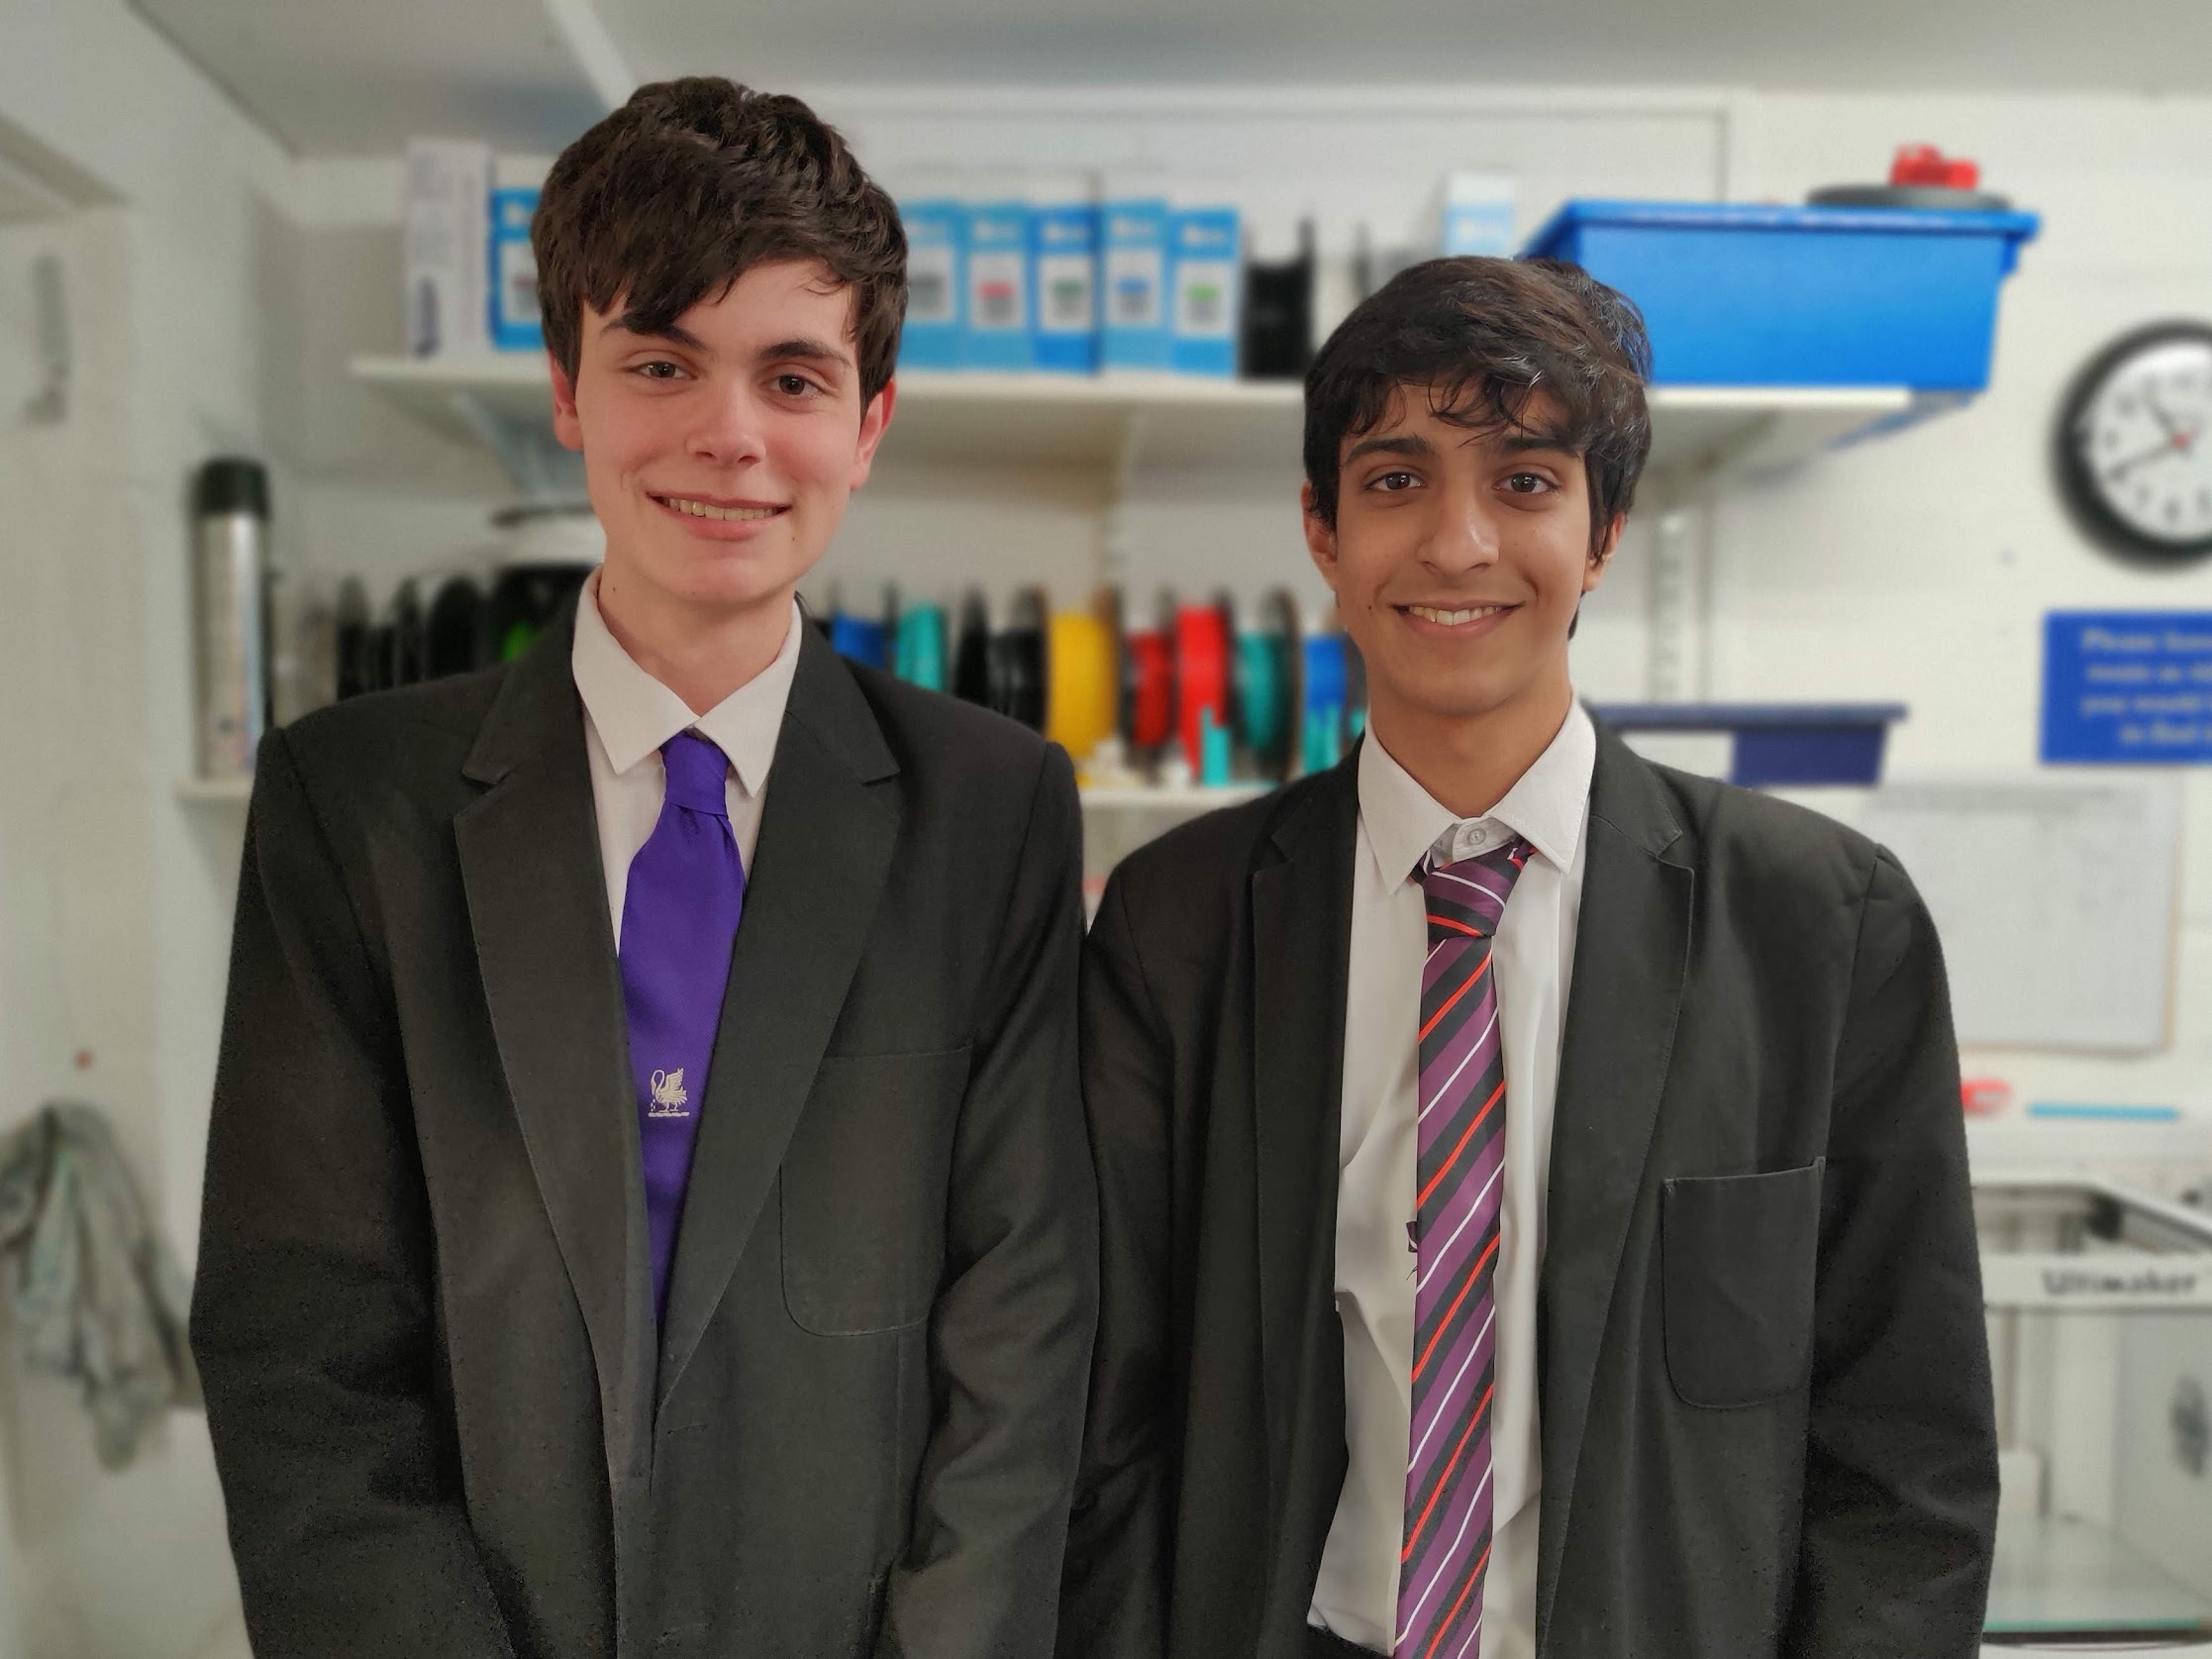
Dom on the left, Sourish on the right.
copied!
failed to copy!